Container shipping rates 2026 data shows a market that looks calmer on the surface than it actually is, with underlying volatility still driven by rerouted vessels, canal restrictions, and shifting demand that catches unprepared shippers off guard.
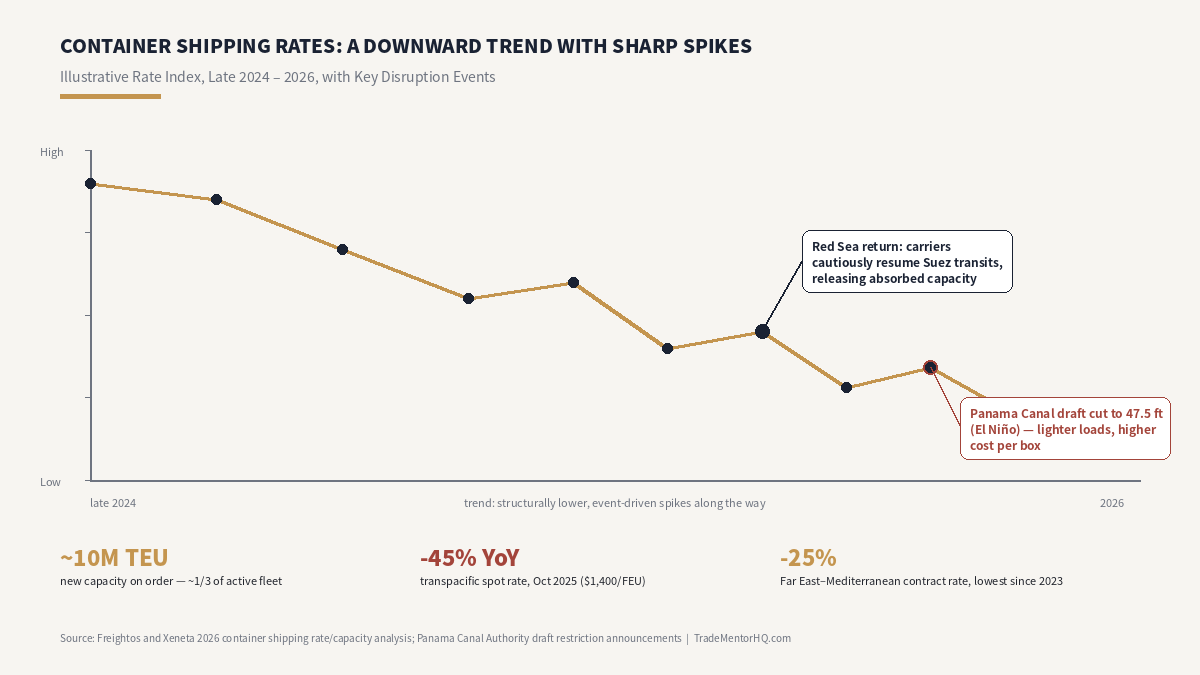
Anyone booking ocean freight in 2026 has probably noticed the same rate quote can look completely different a few weeks apart — and it isn’t random. Two opposing forces are pulling container rates in different directions at the same time, which is exactly what volatility looks like from the shipper’s side. A historic surge in new ship capacity is pushing rates structurally lower through 2026, while recurring disruptions — carriers cautiously returning to the Red Sea and a fresh round of Panama Canal draft restrictions — are creating sharp, temporary spikes on top of that downward trend.
The Big Structural Force: Too Many New Ships
The single largest factor behind where rates are headed in 2026 isn’t a disruption at all — it’s supply. An estimated 10 million TEU of container ship capacity, equal to roughly a third of the entire active global fleet, is currently on order and arriving in waves through the next several years, significantly outpacing growth in actual cargo demand. That imbalance has already shown up in spot pricing: transpacific spot rates fell to around $1,400 per FEU by October 2025, down roughly 45% year-on-year from pandemic-era highs.
Unlike a sudden shock, this kind of oversupply is a slow-moving, structural problem, and carriers have a much harder time managing it through blank sailings and vessel idling than they do with a short, sharp disruption — which is why most forecasts point to rates staying lower through 2026 with occasional spikes rather than a steady, predictable baseline.
The Red Sea Wildcard: Ships Are Cautiously Going Back
For roughly two years, most container lines rerouted around the Cape of Good Hope to avoid Houthi attacks in the Red Sea, adding significant sailing distance and, in effect, absorbing a large chunk of the industry’s excess capacity by keeping ships at sea longer. In early 2026 that started to reverse: Maersk announced a return to full Suez Canal transits for one of its major loops after successful test voyages, and CMA CGM announced planned returns on some services too — though CMA CGM subsequently reversed course on part of that plan, underscoring how unsettled the situation still is.
Every ship that goes back to the shorter Suez routing releases capacity that had effectively been soaked up by the longer Cape route, adding to the oversupply problem rather than easing it. That’s already visible in contract pricing: Far East to Mediterranean contract rates were down about 25% by late January, reaching their lowest level since 2023, and Far East to North Europe rates were down around 10% over the same window and roughly 27% versus a year earlier — even though both remain well above pre-crisis, end-2023 levels.
A Concrete Illustration: Panama Canal Draft Restrictions
The Panama Canal adds a second, unrelated source of volatility in 2026. 5 feet by early September. The Authority has been clear that these cuts don’t reduce the number of daily transit slots, but a lower draft limit forces container ships to sail lighter, carrying fewer boxes per voyage to stay within the weight limit, which raises the effective cost per container even when nothing else about the route changes. 6 million just to jump the queue rather than wait out a backlog of over a week.
Current restrictions remain less severe than the 2023-24 drought that forced ships to reroute entirely, but the pattern illustrates how a single weather-driven bottleneck can spike costs on affected routes independent of anything happening with overall fleet capacity.
How Carriers Try to Smooth These Swings
Ocean carriers’ main lever for managing rate volatility is capacity discipline — cancelling scheduled sailings (“blank sailings”) or idling vessels to keep supply roughly matched to demand and prevent rates from collapsing further. That tool works reasonably well against a short, sharp shock, where a handful of blanked sailings can quickly rebalance a temporary supply-demand gap.
It works far less well against the kind of gradual, structural oversupply driven by a multi-year wave of newbuild deliveries, because the imbalance keeps replenishing itself faster than any single round of blank sailings can absorb — which is part of why 2026’s overall rate trend and its individual route-level spikes can be moving in opposite directions at the same time.
What This Means for Anyone Booking Cargo in 2026
For an importer or exporter, the practical takeaway is that a single rate quote in 2026 tells you less than it used to. Contract rates and spot rates have been diverging meaningfully on some lanes, so it’s worth checking both before committing to a long-term agreement, and building in some flexibility for routes that pass through the Red Sea or Panama Canal specifically, since those are the two spots most likely to produce a sudden, route-specific spike layered on top of the broader downward trend.
Shippers who track a benchmark index rather than relying on a single carrier’s quote tend to spot these divergences earlier and negotiate from a stronger position.
The Bottom Line
2026’s container rate volatility comes from two different forces pulling in opposite directions: a historic oversupply of new vessel capacity pushing rates down structurally, and recurring disruptions — Red Sea routing decisions and Panama Canal draft restrictions chief among them — creating sharp, temporary spikes on specific lanes. Understanding which force is driving a particular rate move matters for anyone deciding whether to lock in a contract rate or ride the spot market.
Source: Industry rate analysis and forecasting from Freightos and Xeneta on 2026 container shipping capacity and Red Sea rerouting; reporting on 2026 Panama Canal Authority draft restrictions.
What’s driving container shipping rates 2026 volatility
Container shipping rates 2026 remain volatile for reasons that have little to do with normal supply and demand cycles. Vessel rerouting around conflict zones, canal draft restrictions limiting transit capacity, and uneven post-pandemic fleet deployment all combine to produce sudden rate spikes and equally sudden corrections that catch shippers who budget off last quarter’s quote by surprise.
Tracking container shipping rates 2026 requires watching several distinct signals simultaneously: spot rate indices, vessel capacity utilization on specific trade lanes, and geopolitical disruption risk on the routes that matter to your specific shipments. A shipper watching only the headline global rate index will miss lane-specific spikes that container shipping rates 2026 data often shows well before they hit the broader average.
Red Sea rerouting and its lasting effect on rates
The ongoing diversion of vessels away from the Red Sea and Suez Canal toward the longer Cape of Good Hope route remains one of the biggest structural drivers behind container shipping rates 2026. Longer transit times effectively remove capacity from the global fleet, and that capacity reduction shows up directly in container shipping rates 2026 on Asia-Europe and Asia-US East Coast lanes specifically.
Even as some carriers cautiously test a partial return to Red Sea transit, container shipping rates 2026 on affected lanes remain sensitive to any new security incident, since a single disruption can send bookings and rates swinging again within days.
Panama Canal draft restrictions and their fading but real impact
Panama Canal draft restrictions, while less severe than in previous drought years, continue to influence container shipping rates 2026 on routes connecting Asia to the US Gulf and East Coast. Reduced daily transit slots push some carriers toward alternative routings, adding cost and time that shows up in container shipping rates 2026 for shippers using that corridor.
Because canal capacity is weather-dependent, container shipping rates 2026 on Panama-adjacent lanes can shift with rainfall patterns in ways that are hard to predict more than a few months out, making this one of the harder variables for shippers to plan around when budgeting freight costs for the year.
Demand-side factors shaping container shipping rates 2026
Beyond routing disruptions, container shipping rates 2026 are also shaped by ordinary demand-side factors: inventory restocking cycles, shifting consumer demand patterns, and manufacturing relocation away from single-country sourcing. A surge in nearshoring or friend-shoring activity has modestly reduced container shipping rates 2026 pressure on some traditional long-haul lanes while increasing it on shorter regional trade routes.
Fleet overcapacity from newbuild deliveries ordered during the 2021-2022 rate boom also continues to weigh on container shipping rates 2026, giving carriers less pricing power on routes without acute disruption, even as disrupted lanes see the opposite effect.
How shippers can manage exposure to container shipping rates 2026
Given how unpredictable container shipping rates 2026 have proven, shippers with meaningful freight volume increasingly negotiate longer-term contract rates with carriers rather than relying entirely on the spot market, trading some potential upside during calm periods for protection against sudden spikes. This approach works best when contract volume commitments are realistic and carriers have genuine incentive to honor the agreed rate during a disruption.
Smaller shippers without the volume to negotiate favorable contracts can still manage container shipping rates 2026 exposure by booking further in advance during known peak periods, diversifying across more than one carrier and routing option, and building freight cost buffers into customer quotes rather than assuming today’s rate will hold through fulfillment.
Forecasting container shipping rates 2026 for budgeting purposes
Freight forwarders and logistics platforms now publish regular container shipping rates 2026 outlooks that combine capacity data, disruption risk assessments, and demand forecasts. These are useful directional tools, but shippers should treat any single forecast for container shipping rates 2026 as a scenario rather than a guarantee, given how quickly a new disruption can invalidate assumptions that looked solid just weeks earlier.
Building a simple range — a base case, an optimistic case, and a disruption case — into freight budget planning tends to produce more resilient budgets than committing to one point estimate for container shipping rates 2026, especially for businesses with thin margins that a rate spike could meaningfully affect.
Regional differences in container shipping rates 2026
Not every trade lane experiences container shipping rates 2026 volatility equally. Transpacific routes connecting Asia to the US West Coast have generally seen more stable pricing than Asia-Europe lanes affected by Red Sea rerouting, since West Coast routes avoid the Suez and Panama chokepoints entirely. Shippers with routing flexibility sometimes shift volume toward comparatively calmer lanes specifically to reduce rate volatility exposure.
Intra-Asia and short-sea routes have their own dynamics largely disconnected from the long-haul disruptions driving headline container shipping rates 2026 volatility, since these routes are less exposed to canal restrictions and more sensitive to regional fuel costs and port congestion at specific hub ports instead.
Common mistakes shippers make around container shipping rates 2026
A frequent mistake is locking in annual budgets based on a single rate snapshot taken early in the year, without building in room for the mid-year swings that container shipping rates 2026 have repeatedly shown. Businesses that treat freight cost as a fixed line item rather than a variable one are consistently caught off guard by disruption-driven spikes.
Another common mistake is ignoring lane-specific data in favor of headline global averages. A shipper focused only on aggregate container shipping rates 2026 trends can miss a lane-specific spike affecting their exact route weeks before it shows up in the broader index, losing valuable lead time to adjust bookings or renegotiate customer pricing.
Frequently asked questions
Are container shipping rates 2026 expected to stabilize soon? Analysts remain divided; much depends on whether Red Sea transit fully normalizes and whether new vessel deliveries continue outpacing demand growth, both of which remain genuinely uncertain.
Do small shippers have any leverage to manage rate volatility? Yes — booking further ahead, diversifying carriers, and building cost buffers into quotes all help, even without the volume needed to negotiate dedicated contract rates.
Which trade lanes are most exposed right now? Asia-Europe and Asia-US East Coast lanes remain most exposed due to Red Sea rerouting and Panama Canal sensitivity, while transpacific West Coast routes have generally been comparatively steadier.
What to watch going forward
Three indicators are worth monitoring closely: whether major carriers resume regular Suez transit, how Panama Canal rainfall and reservoir levels trend through the year, and whether new vessel orders placed during the prior capacity boom continue entering service faster than older tonnage is scrapped. Each of these will keep shaping pricing on the lanes most exposed to disruption.
Shippers who build a habit of checking lane-specific data rather than relying purely on headline averages, and who maintain some contractual flexibility rather than locking into rigid annual agreements, tend to navigate a volatile freight market considerably better than those who treat pricing as static from one quarter to the next.
How carriers respond to rate volatility
Ocean carriers manage volatility on their side through blank sailings — canceling scheduled voyages to match capacity with softer demand — and through general rate increases announced with varying lead time before peak shipping periods. Both tools directly shape container shipping rates 2026 and are worth tracking as leading indicators rather than waiting for the rate itself to move first.
Carrier alliances also coordinate capacity deployment across major trade lanes, and a shift in alliance strategy — adding or dropping a service loop, for instance — can ripple into rates on affected routes well before it appears in published pricing, giving attentive shippers a modest early-warning signal.
The role of fuel costs and environmental regulation
Bunker fuel prices and compliance costs tied to emissions regulations add another layer of variability on top of routing and demand factors. Low-sulfur fuel surcharges and emerging carbon pricing mechanisms for shipping are increasingly built into freight quotes as separate line items, and these can move somewhat independently of the base freight rate itself.
Shippers evaluating total landed freight cost should account for these surcharges separately rather than assuming the headline rate captures the full cost, since environmental compliance charges have grown as a share of total freight spend in recent years and show no sign of shrinking.
Practical takeaway for freight budgeting
Build a small contingency line into every freight budget rather than treating the current quote as fixed, review lane-specific rate trends at least monthly rather than annually, and keep a backup carrier or routing option identified in advance for your most important lanes so a sudden disruption does not leave you scrambling for capacity at the worst possible moment.
For live freight rate benchmarks, see the Freightos Baltic Index. For more shipping cost analysis, see our TradeMentorHQ homepage.
Planning Around Volatile Shipping Rates
Container shipping rates 2026 will likely stay unpredictable rather than settling into a calm, steady pattern, since the structural drivers behind the volatility — geopolitical routing disruptions, canal capacity limits, and a still-adjusting global fleet — show no clear sign of fully resolving in the near term. Planning for continued swings, rather than hoping for stability, remains the more realistic posture for any business that depends on ocean freight.
For context on just how volatile this market can get, the Shanghai–Los Angeles spot rate swung from around $1,500 per FEU in early 2020 to over $15,000 per FEU at the peak of the 2021–2022 congestion crisis, then fell back to a more typical $2,000–4,000 range once port backlogs cleared — a roughly 10x swing within about two years.
Tracking indices like the Drewry World Container Index or Freightos Baltic Index week-to-week (both are free to check) gives a far more current read than relying on a quote you got a few months ago, since a rate that was accurate in Q1 can be stale by Q3 in either direction. If you’re budgeting for a shipment months out, it’s worth pricing in a rate buffer rather than locking your margins to today’s spot number.
Related Reading
- FCL vs LCL Shipping: A Cost and Timing Comparison for First-Time Exporters
- Freight Forwarder vs Customs Broker: What’s the Difference?
Written by the TradeMentorHQ editorial team. We research primary sources — ocean freight rate analysis from Freightos and Xeneta, and current Panama Canal Authority announcements — before every article, and we’re upfront about how the site is produced on our About page. Spotted something that needs a correction? Let us know.

About the Author: TradeMentorHQ Team
The TradeMentorHQ team researches and writes practical, plain-language guides on Incoterms, customs clearance, trade finance, and shipping logistics for small business owners, first-time importers/exporters, and side-hustle sellers. Our articles are grounded in publicly available regulations and guidance from bodies like U.S. Customs and Border Protection (CBP), the International Chamber of Commerce (Incoterms 2020), and established industry practice, and we link to primary sources wherever a number or rule could change. We are not customs brokers, freight forwarders, or licensed trade attorneys, and nothing here is a substitute for advice from one on your specific shipment.